Looking to create a new app and I wanted to experiment with Flutter. My two concerns of themeing and charts were alieviated by two blog posts, but let’s try it out!
Installing Flutter
The dreaded step is always installing an SDK just for experimenting… but here we go.
Installation Link: https://flutter.dev/docs/get-started/install
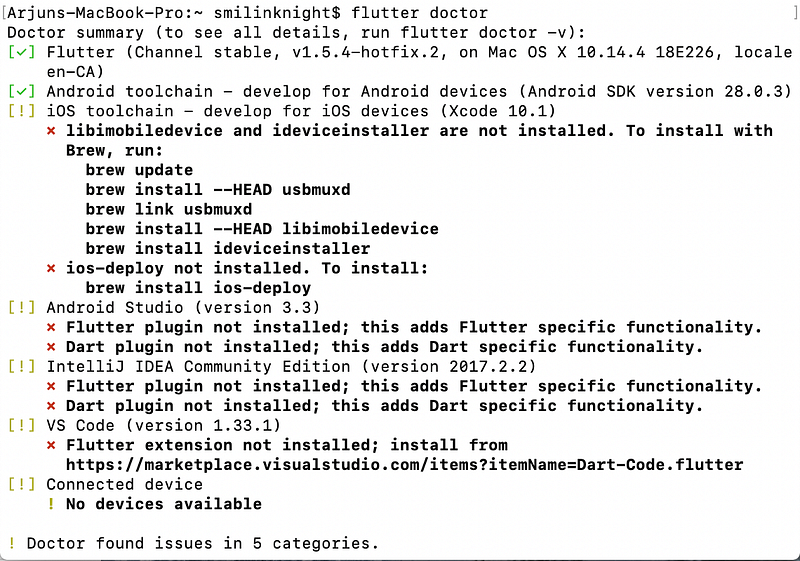
I needed to fix some installation issues which Flutter helped me out with. For a front-end developer, this was really helpful.
Unfortunately it also took forever, thanks to XCode.
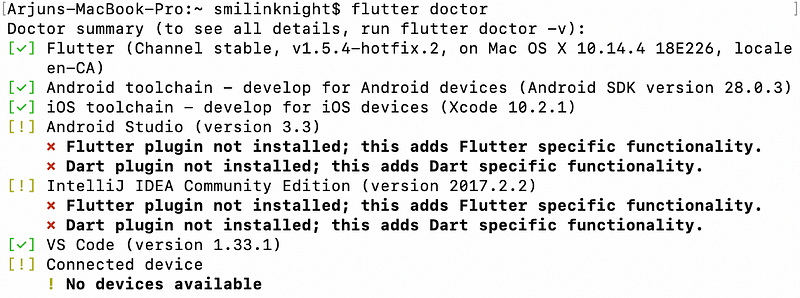
After forever, we’re now ready to go! (I’m choosing to work in VS Code)
Andriod Emulator and iOS Simulator
Before I could get to coding I had to set up the Android and iOS devices on my machine. Fortunately I had ones set up for previous projects, I just needed to launch them like so:
$ flutter emulators
$ flutter emulators --launch Pixel\_2\_XL\_API\_28
$ flutter emulators --launch iOS Simulator
$ flutter run -d all
This runs the starter app on both!
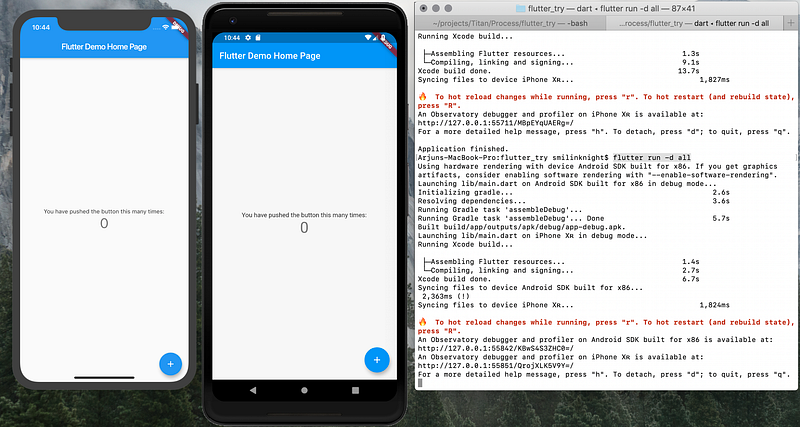
Starter App
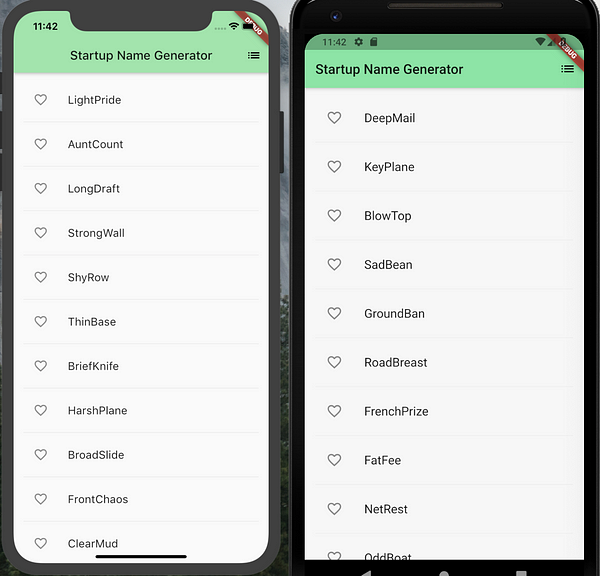
Now to start messing around! I’m using this tutorial provided from the Flutter team as a start.
With the tutorial, I created a list (useful) and started learning about Flutter’s state (not really though).
I continued on to part 2, which had me add interactive icons to list items to save them, navigate to a page to view saved list items, and begin theming the app.
Theming
Theming is one of the big reasons I wanted to try Flutter and it’s got a theming framework I wanted to try.
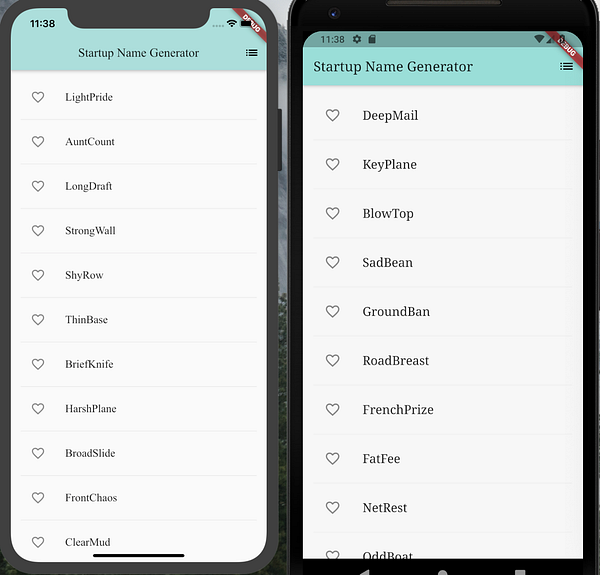
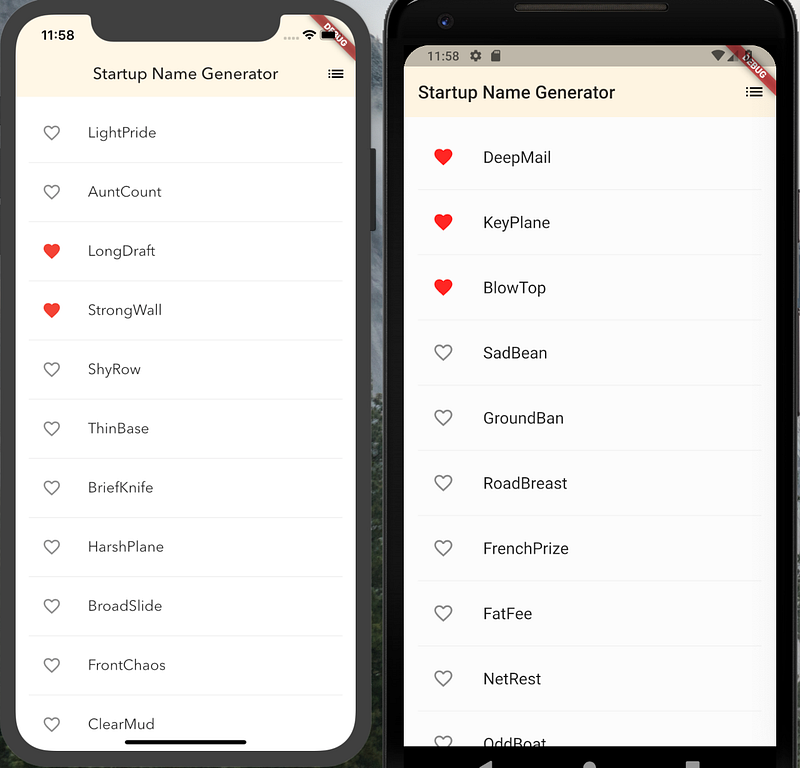
 Times and Blue
First try at theming was promising, even just with changing the font and the primary colour. I feel like it’s generally stuck to the typical Material Design layout with the AppBar shadow and the darker background colour. Fortunately, I was quickly able to fix those, but I’m not certain I can make Flutter bend to all my UI wishes, would need more exploration.
Graphs
Equally important as theming is the ability to have good graphs. For this I’m looking at charts_flutter recommended by the quick tutorial blog post here.
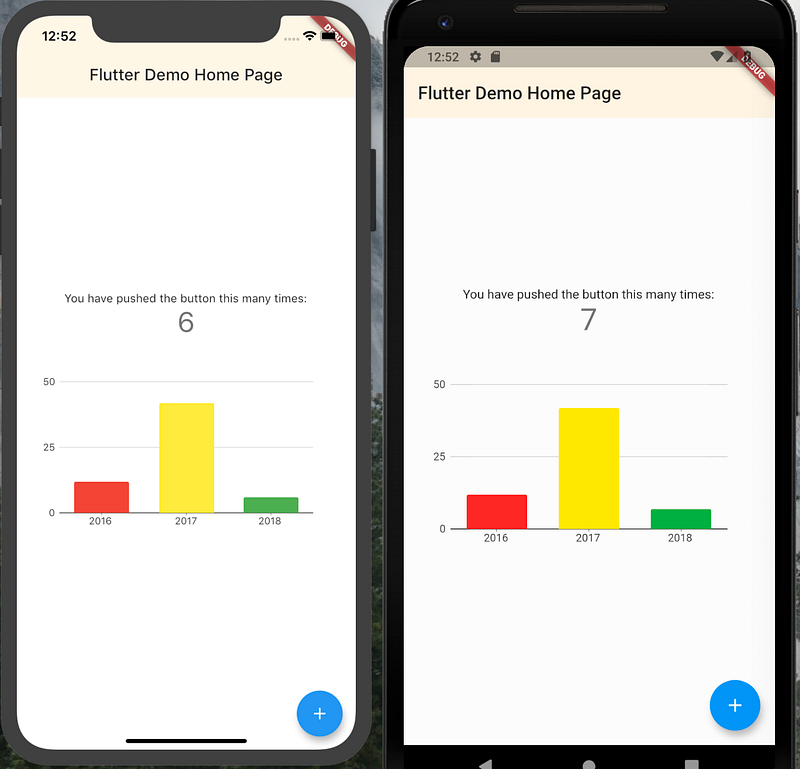
The tutorial is to get a bar chart up but I need a line chart with specific properties, which proved to be much more difficult thanks to some of the code from the bar chart tutorial messing me up. I had to redo the bar chart demo a couple of times and add in this Line Chart demo carefully.
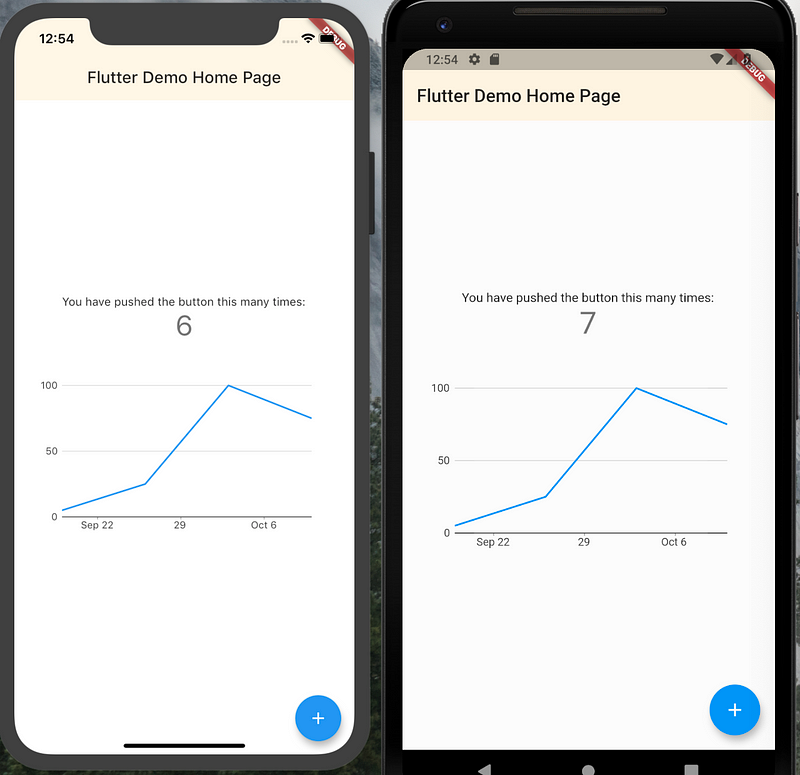
I don’t care for my chart being interactive, so I dropped that extra fluff from the tutorial. What I need is to make the graph moveable and zoomable along the yaxis, which I don’t think flutter_charts will be able to do.
But I tried anyway, starting with a bunch of different tutorials from here. I actually ran into a lot of errors while trying to set all these up and while some of them were clearly due to my unfamiliarity with Flutter, some of them were very: 🤨. That’s a drawback.
I ended up finding the Numeric Initial Viewport Axes Example which did the scrolling y-axis for me and just needed to combine it with the Selection Callback Interactions Example (which features a TimeSeriesChart, which I need). This actually proved to be quite difficult.
In the end I wasn’t able to get it to work seemingly due to a bug that hasn’t been fixed. This is how it would’ve worked though, by setting up a viewport and allowing PanAndZoomBehavior.:
new charts.TimeSeriesChart(
  widget.seriesList,
  animate: widget.animate,
  domainAxis: new charts.DateTimeAxisSpec(
     viewport: new charts.DateTimeExtents(
          start: new DateTime(2017, 10, 3),
          end: new DateTime(2017, 10, 10))),
  behaviors: \[new charts.PanAndZoomBehavior()\],
  selectionModels: \[new charts.SelectionModelConfig(
     type: charts.SelectionModelType.info,
     changedListener: \_onSelectionChanged,
  )\],
)
Turns out Flutter isn’t capable of the graphing I need :(
Conclusion
In conclusion, Flutter seems like a pretty cool way to make apps but unfortunately it’s chart library isn’t functional and customizable enough.
Looks like I’m sticking to Ionic Angular with plot.ly :)
Follow me
For more of my coding, designing, and problem solving journey, follow me on Twitter and Medium. I like to post about new things I’m doing and am interested in. :)

